If you read the news each day, you might be under the impression that few people drive to work alone. Headlines frequently shout about the popularity of carpools and HOV lanes and new bike paths and how more people than ever are taking mass transit — especially in Planet Earth’s growing cities.
But the website Flowing Data was suspicious of such assumptions. And so, it took data from the United States Census Bureau’s 2013 American Community Survey and compiled it into a beautiful, interactive, county-by-county map that shows exactly how Americans get to work.
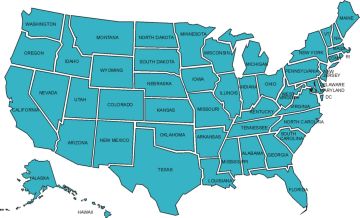
When the page first loads, the map is almost entirely light blue — the color Flowing Data used to identify folks who drive to work by themselves (i.e. with no fellow passengers). Roughly 80 percent of Americans commute like this.
The only exceptions are in a few metro areas like New York City, where mass transportation is king. Also in remote areas of Alaska, it appears that people tend to walk or take some alternative form of transportation — which could be accurate, or could be skewed by small sample sizes.
Take out the “drive alone” option by clicking the blue button at the top of the page, and the map becomes a bit more variegated. Purple is the predominant color, suggesting that many workers’ second transportation option is carpooling — though in reality, carpools only account for around ten percent of U.S. commutes.
You might be surprised to see large portions of the Midwest covered in green, indicating that people in those areas work from home. As Flowing Data points out, though, those people probably aren’t telecommuting as much as they’re working the family farm. Roughly five percent of those included in the Bureau’s survey work from home.
Click here to see the map for yourself. Hover your mouse over a particular county, and the transit data for that county will pop up. We were a little surprised by some of the data from our various necks of the woods — how about you?
To see the original article, go to The Car Connection.